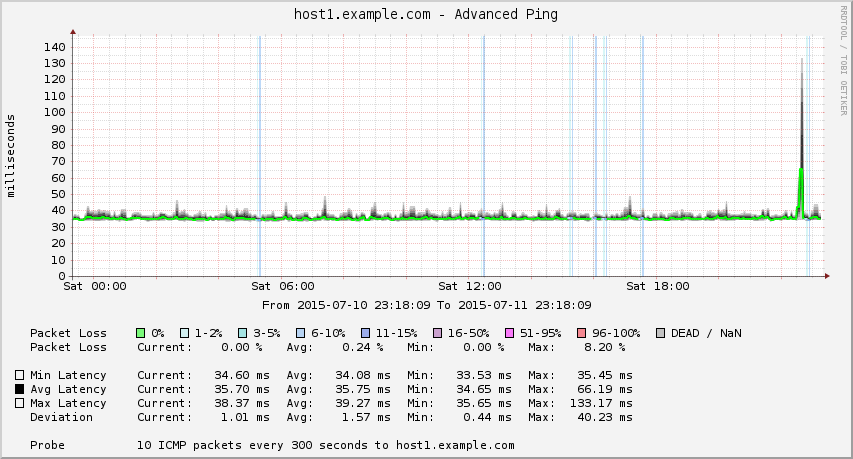
Cacti is a wonderful tool, but many of the default graphs are ugly. Worse, the “ucd/net Memory Usage” graph is totally useless. It displays memory which is free, or dedicated to cache or buffers. But it doesn’t display the actual used memory or total. And it uses the wrong base, assuming there are 1000 bytes in a kilobyte of memory. I can’t imagine why this graph template is even included with Cacti by default. So, I set out to make a better one.
You are currently browsing articles tagged cacti.
Tags: cacti
I’ve updated temper-mon and my Cacti templates to better work with the TEMPerNTC device, which has an external temperature sensor in addition to the internal one.
I graph the temperature of my server cabinet (at home) and colocation room (at work) in Cacti, using TEMPer USB thermometers. I wrote a handy guide to doing this last year. Unfortunately that guide, and the software I wrote, only worked to query one device. Today I modified it to graph more than one device, and started graphing the ambient temperature of my house.
Update 2012-07-25: These instructions have been (mostly) superseded by a new version of this guide. Follow that document instead.
I recently acquired a TEMPer USB thermometer. It’s a cheap, convenient way to measure temperature in your server closet or machine room. My home “server closet” consists of the living room entertainment center, which is an enclosed wooden structure. It gets pretty hot, so I decided to track the ambient temperature with Cacti.
I use a number of open-source tools that rely on rrdtool to generate graphs. Cacti uses it for its core functionality. BackupPC uses it to graph storage pool usage over time. Unfortunately, the files it generates are architecture-dependent. This means that if you upgrade your BackupPC server from i386 to amd64, your pool graphs will mysteriously disappear. Shall we fix that?
Recent Comments