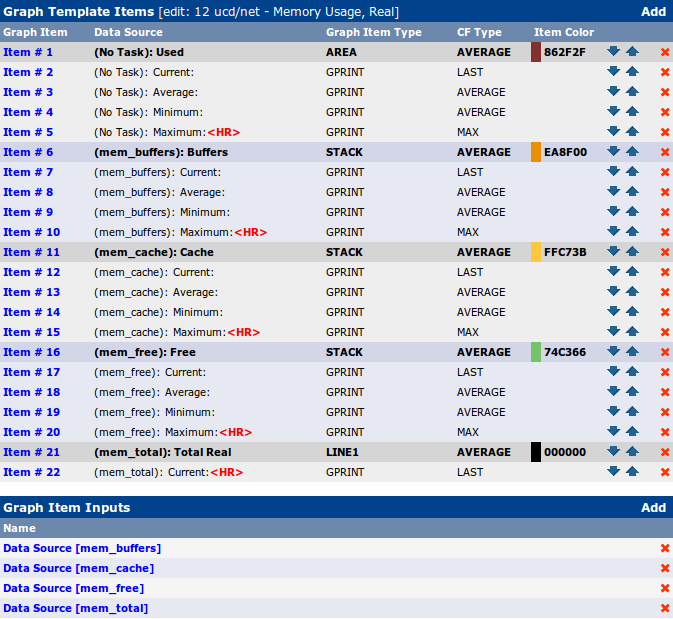
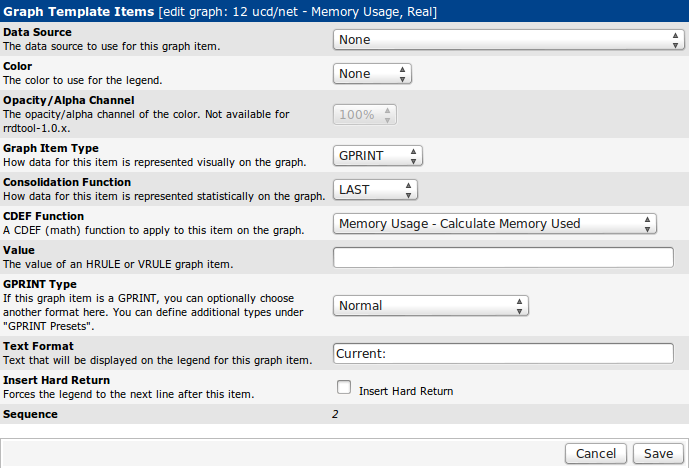
Cacti is a wonderful tool, but many of the default graphs are ugly. Worse, the “ucd/net Memory Usage” graph is totally useless. It displays memory which is free, or dedicated to cache or buffers. But it doesn’t display the actual used memory or total. And it uses the wrong base, assuming there are 1000 bytes in a kilobyte of memory. I can’t imagine why this graph template is even included with Cacti by default. So, I set out to make a better one.
Here is the default graph:
(Click to embiggen)
The implementation for “used memory” in the SNMP OID is inconsistent across devices. But you can fetch “total memory”, and do the math:
Used memory = Total – (Free + Cache + Buffers)
Many people have used this method to make better memory usage templates. Eric A. Hall made a much prettier graph, but it relies on an external script to fetch the data and do the math. This is unnecessary, and (slightly) slower than using Cacti CDEF functions. Hans Fugal used CDEF functions, but his graphs use an eye-searing colour scheme. He also uses the wrong base; there are 1024 bytes in a kilobyte of RAM, not 1000 as in hard drives or network data rate.
Here are mine:
My implementation uses Eric Hall’s colour scheme and Hans Fugal’s CDEF method, but graphs real memory and swap as two separate graphs. It also uses the correct unit base of 1024. These graphs are also intended for Linux. Unix operating systems won’t report Buffers or Cache, but they’ll graph correctly as long as they report Free and Total.
Downloads:
cacti_graph_template__ucdnet_-_memory_usage_real.xml
cacti_graph_template__ucdnet_-_memory_usage_swap.xml
Only after making my own did I discover fmangeant‘s graphs. These use the CDEF method and correct base, although I’m not fond of the colours. The “Memory Usage Unix” graph would be useful if your device doesn’t report Buffers or Cache and you don’t want to see zero values on your graph.
Tags: cacti
-
I implemented Memory Usage Real. All except Used memory are fine. For Used Memory the values are nan. How can I solve this problem?
-
The others are showing values except for Used Memory.
Yes. The CDEF “Memory Usage – Calculate Memory Used” is also imported. I’ve also implemented in all 5 graph items under “Used” Data Source.
You are referring to the Poller Interval under Settings? If that’s so it’s already at 5 minutes.
-
/usr/bin/rrdtool graph - \
--imgformat=PNG \
--start=-86400 \
--end=-300 \
--title='my-adsl - Memory Usage, Real' \
--base=1024 \
--height=120 \
--width=750 \
--alt-autoscale-max \
--lower-limit='0' \
--vertical-label='bytes' \
--slope-mode \
--font TITLE:10: \
--font AXIS:7: \
--font LEGEND:8: \
--font UNIT:7: \
DEF:a="/var/www/cacti/rra/my-adsl_usedreal_293.rrd":'usedReal':AVERAGE \
DEF:b="/var/www/cacti/rra/my-adsl_mem_buffers_312.rrd":'mem_buffers':AVERAGE \
DEF:c="/var/www/cacti/rra/my-adsl_mem_cache_313.rrd":'mem_cache':AVERAGE \
DEF:d="/var/www/cacti/rra/my-adsl_mem_free_314.rrd":'mem_free':AVERAGE \
DEF:e="/var/www/cacti/rra/my-adsl_mem_total_315.rrd":'mem_total':AVERAGE \
CDEF:cdefa='a,1024,*' \
CDEF:cdeff='b,1024,*' \
CDEF:cdefba='c,1024,*' \
CDEF:cdefbf='d,1024,*' \
CDEF:cdefca='e,1024,*' \
AREA:cdefa#862F2FFF:"Used"  \
GPRINT:cdefa:LAST:"      Current\:%8.2lf %s"  \
GPRINT:cdefa:AVERAGE:"Average\:%8.2lf %s"  \
GPRINT:cdefa:MIN:"Minimum\:%8.2lf %s"  \
GPRINT:cdefa:MAX:"Maximum\:%8.2lf %s\n"  \
AREA:cdeff#EA8F00FF:"Buffers":STACK \
GPRINT:cdeff:LAST:"   Current\:%8.2lf %s"  \
GPRINT:cdeff:AVERAGE:"Average\:%8.2lf %s"  \
GPRINT:cdeff:AVERAGE:"Minimum\:%8.2lf %s"  \
GPRINT:cdeff:MAX:"Maximum\:%8.2lf %s\n"  \
AREA:cdefba#FFC73BFF:"Cache":STACK \
GPRINT:cdefba:LAST:"     Current\:%8.2lf %s"  \
GPRINT:cdefba:AVERAGE:"Average\:%8.2lf %s"  \
GPRINT:cdefba:AVERAGE:"Minimum\:%8.2lf %s"  \
GPRINT:cdefba:MAX:"Maximum\:%8.2lf %s\n"  \
AREA:cdefbf#74C366FF:"Free":STACK \
GPRINT:cdefbf:LAST:"      Current\:%8.2lf %s"  \
GPRINT:cdefbf:AVERAGE:"Average\:%8.2lf %s"  \
GPRINT:cdefbf:AVERAGE:"Minimum\:%8.2lf %s"  \
GPRINT:cdefbf:MAX:"Maximum\:%8.2lf %s\n"  \
LINE1:cdefca#000000FF:"Total Real"  \
GPRINT:cdefca:LAST:"Current\:%8.2lf %s\n"
-
Thanks for the screenshots. I changed the settings according to your screenshots and I don’t know why a new error shows. Here’s my debugging output:
/usr/bin/rrdtool graph - \
--imgformat=PNG \
--start=-86400 \
--end=-300 \
--title='my-adsl - Memory Usage, Real' \
--base=1024 \
--height=120 \
--width=750 \
--alt-autoscale-max \
--lower-limit='0' \
--vertical-label='bytes' \
--slope-mode \
--font TITLE:10: \
--font AXIS:7: \
--font LEGEND:8: \
--font UNIT:7: \
DEF:a="/var/www/cacti/rra/my-adsl_mem_buffers_306.rrd":'mem_buffers':AVERAGE \
DEF:b="/var/www/cacti/rra/my-adsl_mem_cache_307.rrd":'mem_cache':AVERAGE \
DEF:c="/var/www/cacti/rra/my-adsl_mem_free_308.rrd":'mem_free':AVERAGE \
DEF:d="/var/www/cacti/rra/my-adsl_mem_total_315.rrd":'mem_total':AVERAGE \
CDEF:cdefa='d,a,-,b,-,c,-,1024,*' \
CDEF:cdefb='a,1024,*' \
CDEF:cdefd='a,1024,*' \
CDEF:cdefi='b,1024,*' \
CDEF:cdefbd='c,1024,*' \
CDEF:cdefbi='d,1024,*' \
GPRINT:cdefa:LAST:"Current\:%8.2lf %s"  \
GPRINT:cdefb:AVERAGE:"Average\:%8.2lf %s"  \
GPRINT:cdefa:AVERAGE:"Minimum\:%8.2lf %s"  \
:cdefd#EA8F00FF:"Buffers":STACK \
GPRINT:cdefd:LAST:"   Current\:%8.2lf %s"  \
GPRINT:cdefd:AVERAGE:"Average\:%8.2lf %s"  \
GPRINT:cdefd:AVERAGE:"Minimum\:%8.2lf %s"  \
GPRINT:cdefd:MAX:"Maximum\:%8.2lf %s\n"  \
:cdefi#FFC73BFF:"Cache":STACK \
GPRINT:cdefi:LAST:"     Current\:%8.2lf %s"  \
GPRINT:cdefi:AVERAGE:"Average\:%8.2lf %s"  \
GPRINT:cdefi:AVERAGE:"Minimum\:%8.2lf %s"  \
GPRINT:cdefi:MAX:"Maximum\:%8.2lf %s\n"  \
:cdefbd#74C366FF:"Free":STACK \
GPRINT:cdefbd:LAST:"      Current\:%8.2lf %s"  \
GPRINT:cdefbd:AVERAGE:"Average\:%8.2lf %s"  \
GPRINT:cdefbd:AVERAGE:"Minimum\:%8.2lf %s"  \
GPRINT:cdefbd:MAX:"Maximum\:%8.2lf %s\n"  \
LINE1:cdefbi#000000FF:"Total Real"  \
GPRINT:cdefbi:LAST:"Current\:%8.2lf %s\n"
RRDTool Says:
ERROR: Could not make sense out of ‘:cdefd#EA8F00FF:Buffers:STACK’
-
Got it. Thanks a lot. My graph is working well now.
-
Thanks for these, they just worked and are great!
-
I just tried to import your templates you had in this document. I see all the items in the cacti sections.
[code]
/usr/bin/rrdtool create \
/var/lib/cacti/rra/localhost_mem_total_64.rrd \
–step 60 \
DS:mem_total:GAUGE:120:0:U \
RRA:AVERAGE:0.5:1:500 \
RRA:AVERAGE:0.5:1:600 \
RRA:AVERAGE:0.5:6:700 \
RRA:AVERAGE:0.5:24:775 \
RRA:AVERAGE:0.5:288:797 \
RRA:MIN:0.5:1:500 \
RRA:MIN:0.5:1:600 \
RRA:MIN:0.5:6:700 \
RRA:MIN:0.5:24:775 \
RRA:MIN:0.5:288:797 \
RRA:MAX:0.5:1:500 \
RRA:MAX:0.5:1:600 \
RRA:MAX:0.5:6:700 \
RRA:MAX:0.5:24:775 \
RRA:MAX:0.5:288:797 \
RRA:LAST:0.5:1:500 \
RRA:LAST:0.5:1:600 \
RRA:LAST:0.5:6:700 \
RRA:LAST:0.5:24:775 \
RRA:LAST:0.5:288:797 \
[/code]This is being output by cacti in the data source debugger. But the file is not being created on the file system. If I run the same from the CLI using the same user as the cacti process it creates it fine. But for whatever reason cacti is not generating this file on its own. If I create data sources from the default cacti templates/sources it is creating the rrd files with no issues. Any idea why your templates would not be allowing cacti to create them on its own?
-
-
-
-


14 comments
Comments feed for this article
Trackback link: https://www.tolaris.com/2013/02/28/better-cacti-memory-usage-graphs/trackback/