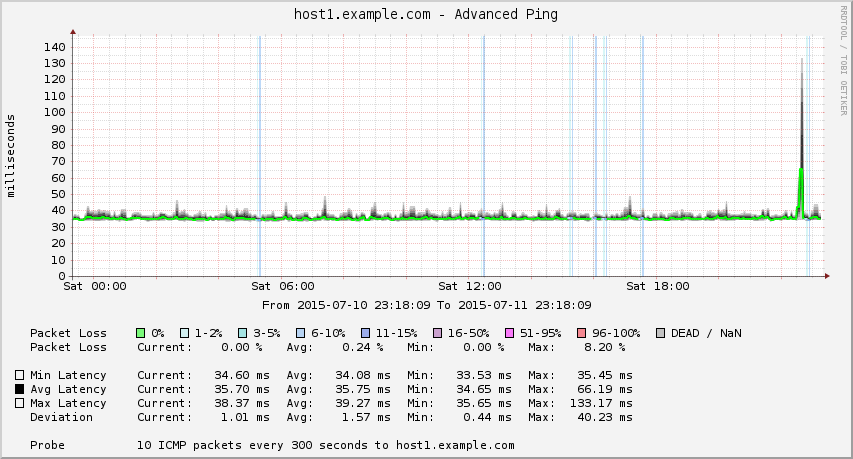
I use an advanced ping template with Cacti to monitor ICMP latency. Advanced Ping is based on a template originally found on the Cacti forums, but modified to look more like Smoke Ping. My thanks go to my colleague at Talia, Enno, for making it look beautiful as well as functional.
Installation
- Download the Advanced Ping tar archive.
- Extract the xml template and ss_fping.php.
- Copy ss_fping.php to the Cacti “scripts” directory, such as /var/www/cacti/scripts.
- Ensure ss_fping.php is readable by the web server’s user. Readable by all is safe. It does not need to be executable.
- In the Cacti web interface, import cacti_graph_template__00_advanced_ping.xml.
- Optionally, rename the template to remove the leading 00 (I prefer this graph to be sorted above all others), or to change its width from 750 to 500 pixels.
Add this graph template to a host and create the graph. You will be prompted what type of ping (ICMP or UDP), timeout, and port (if UDP).
Tags: cacti
-
Be aware, at some cases you can damage your cacti instance, due to multi add of colors with 0 id.
To repair, execute a SQL query “delete from colors where id =0” -
when importing the XML file I get an error which is
Hash version does not exist. any help please ?
-
Hello, I have installed Advanced Ping but i have some problems. Cacti graphs latency in ms but the data quuery associated is empty.. Somebody could help me?
Thanks -
Add it successfuly and also graph correctly
Some modification needed manually.
1. Add name to data template
2. Add name to graph template.Thats all.
-
Add it successfuly and also graph correctly,
but Packet Loss showing as nan
-
Hi,
Thanks for this material!
However, I need some help.
I tried to import this template to my Cacti install (Version 0.8.8.b) and it is not working.
I get this error message while importing: Error: XML: Hash version does not exist.
And in the Graph Templates list I get an empty line.
And also many empty lines on the CDEF’s.
And I can’t make the graph to work.
Can you provide any help on how to make it work?
Thanks in adance!
Manoel
-
I am trying to do UDP ping with Advanced Ping and it works well for port 53 (DNS) but it does not work with port 123 (NTP). Any ideas? Tried Advanced Ping Alt – same thing… Here is the RRDTool Command output:
/usr/bin/rrdtool graph – \
–imgformat=PNG \
–start=’-86400′ \
–end=’-300′ \
–title=’ntp4 service test – Advanced Ping’ \
–rigid \
–base=’1000′ \
–height=’120′ \
–width=’500′ \
–alt-autoscale-max \
–lower-limit=’0′ \
–vertical-label=’seconds’ \
–slope-mode \
–font TITLE:10: \
–font AXIS:7: \
–font LEGEND:8: \
–font UNIT:7: \
DEF:a=’/var/lib/cacti/rra/ntp4_service_test_loss_1959.rrd’:’min’:AVERAGE \
DEF:b=’/var/lib/cacti/rra/ntp4_service_test_loss_1959.rrd’:’avg’:AVERAGE \
DEF:c=’/var/lib/cacti/rra/ntp4_service_test_loss_1959.rrd’:’max’:AVERAGE \
DEF:d=’/var/lib/cacti/rra/ntp4_service_test_loss_1959.rrd’:’loss’:AVERAGE \
DEF:e=’/var/lib/cacti/rra/ntp4_service_test_loss_1959.rrd’:’dev’:AVERAGE \
CDEF:cdefa=’a,1000,/’ \
CDEF:cdefb=’b,1000,/’ \
CDEF:cdefc=’c,1000,/’ \
CDEF:cdefe=’e,1000,/’ \
CDEF:cdefg=’b,a,-,e,-,e,-,1000,/’ \
CDEF:cdefh=’e,1000,/’ \
CDEF:cdefbb=’c,b,-,e,-,e,-,1000,/’ \
CDEF:cdefbh=’d,0,GT,d,2,GT,UNKN,b,IF,UNKN,IF,1000,/’ \
CDEF:cdefbi=’d,3,GT,d,5,GT,UNKN,b,IF,UNKN,IF,1000,/’ \
CDEF:cdefbj=’d,5,GT,d,10,GT,UNKN,b,IF,UNKN,IF,1000,/’ \
CDEF:cdefca=’d,10,GT,d,15,GT,UNKN,b,IF,UNKN,IF,1000,/’ \
CDEF:cdefcb=’d,15,GT,d,50,GT,UNKN,b,IF,UNKN,IF,1000,/’ \
CDEF:cdefcc=’d,50,GT,d,95,GT,UNKN,b,IF,UNKN,IF,1000,/’ \
CDEF:cdefcd=’d,95,GT,d,99,GT,UNKN,b,IF,UNKN,IF,1000,/’ \
CDEF:cdefce=’d,99,GT,d,100,GT,UNKN,INF,IF,UNKN,IF’ \
COMMENT:’ ‘ \
COMMENT:’ ‘ \
COMMENT:’ ‘ \
COMMENT:’ ‘ \
COMMENT:’ ‘ \
AREA:cdefa#FFFFFFFF:” \
AREA:cdefg#CCCCCCFF:”:STACK \
AREA:cdefh#AAAAAAFF:”:STACK \
AREA:cdefh#888888FF:”:STACK \
AREA:cdefh#888888FF:”:STACK \
AREA:cdefh#AAAAAAFF:”:STACK \
AREA:cdefbb#CCCCCCFF:”:STACK \
AREA:cdefh#FFFFFFFF:”:STACK \
AREA:cdefh#FFFFFFFF:”:STACK \
AREA:cdefa#FFFFFFFF:” \
COMMENT:’Pkt Loss (color)\:’ \
LINE1:cdefb#00BD27FF:’0%’ \
LINE1:cdefbh#AFECEDFF:’01-02%’ \
LINE1:cdefbi#55D6D3FF:’03-05%’ \
LINE1:cdefbj#7CB3F1FF:’06-10%’ \
LINE1:cdefca#4668E4FF:’11-15%’ \
LINE1:cdefcb#A150AAFF:’16-50%’ \
LINE1:cdefcc#FF00FFFF:’51-95%’ \
LINE1:cdefcd#F51D30FF:’96-100%\n’ \
AREA:cdefce#F51D30FF:” \
COMMENT:’Pkt Loss\:’ \
GPRINT:d:LAST:’ Last\:%6.2lf%%’ \
GPRINT:d:MIN:’Min\:%6.2lf%%’ \
GPRINT:d:AVERAGE:’Avg\:%6.2lf%%’ \
GPRINT:d:MAX:’Max\:%6.2lf%%\n’ \
COMMENT:’RTT (color)\:’ \
HRULE:0#888888FF:'(rttavg +- 1*sdev)’ \
HRULE:0#AAAAAAFF:'(rttavg +- 2*sdev)’ \
HRULE:0#CCCCCCFF:'(rttavg +- 3*sdev)\n’ \
HRULE:0#FFFFFFFF:” \
COMMENT:’RTT Min\:’ \
GPRINT:cdefa:LAST:’Last\:%8.2lf %s’ \
GPRINT:cdefa:MIN:’Min\:%8.2lf %s’ \
GPRINT:cdefa:AVERAGE:’Avg\:%8.2lf %s’ \
GPRINT:cdefa:MAX:’Max\:%8.2lf %s\n’ \
COMMENT:’RTT Avg\:’ \
GPRINT:cdefb:LAST:’Last\:%8.2lf %s’ \
GPRINT:cdefb:MIN:’Min\:%8.2lf %s’ \
GPRINT:cdefb:AVERAGE:’Avg\:%8.2lf %s’ \
GPRINT:cdefb:MAX:’Max\:%8.2lf %s\n’ \
COMMENT:’RTT Max\:’ \
GPRINT:cdefc:LAST:’Last\:%8.2lf %s’ \
GPRINT:cdefc:MIN:’Min\:%8.2lf %s’ \
GPRINT:cdefc:AVERAGE:’Avg\:%8.2lf %s’ \
GPRINT:cdefc:MAX:’Max\:%8.2lf %s\n’ \
COMMENT:’Std Dev\:’ \
GPRINT:cdefe:LAST:’Last\:%8.2lf %s’ \
GPRINT:cdefe:MIN:’Min\:%8.2lf %s’ \
GPRINT:cdefe:AVERAGE:’Avg\:%8.2lf %s’ \
GPRINT:cdefe:MAX:’Max\:%8.2lf %s\n’RRDTool Says:
OK
-
I was able to add this to my Cacti v1.1.27. Script OK, xml imported OK. I was able to add graph to a device, but I was not prompted to change the settings for ICMP, etc. Where can I do this manually after the fact?
Also, does this support 1m polling? I imported using my 1m polling template in the new Cacti but on the graph it still says ‘every 300 seconds’. is this hard coded into the graph?
-
-
-


13 comments
Comments feed for this article
Trackback link: https://www.tolaris.com/2015/07/11/advanced-ping-with-cacti/trackback/