


Update 2018-02-08: This post was written for Cacti 0.8.x. Some details have changed since Cacti 1.0.
You should really, really get your Cacti RRA settings right before you begin using it. Cacti defaults to polling every 5 minutes, but a lot of enterprise users change this to 1 minute in order to provide higher resolution for troubleshooting problems. Unfortunately, there is a lot of incomplete information on how to do this.
The first link is mostly right, but forgets about adjusting RRA steps. Twopacket’s guide is very nearly correct, but warns against changing cron’s poller interval, which is exactly what you should do.
This is another post in my recent series on Cacti. In fact, I’ve written quite a lot about about Cacti.
The Four Changes
There are four things you must do to configure Cacti for 1-minute polling. You should do this before gathering any data.
- Create 1-minute RRA settings.
- Adjust “Step” and “Heartbeat” on all 1-minute Data Source templates.
- Change the poller frequency in cron.
- Change the poller frequency in Cacti settings.
I’m going to focus on the RRA settings first, because this is the one thing you must get right from the start. Once you start collecting data with bad RRA settings, it is extremely difficult to correct it. And by “extremely difficult”, I mean “just throw it away and start over”.
Cacti default 5-minute RRA settings
The default Cacti RRAs expect polling every 5 minutes, and use steps of 1, 6, 24, 288. Multiply by 5 minutes, and that gives RRAs with resolution of 5 minutes, 30 minutes, 2 hours, and 1 day. You can see this in Cacti, under “Console” -> “Management” heading -> “Data Sources” -> RRAs.
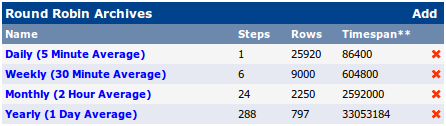
Cacti RRA default settings for 5 minute polling
1-minute Polling: The Wrong Way
It’s common to see 1-minute polling implemented by adding a 1-minute RRA like so:
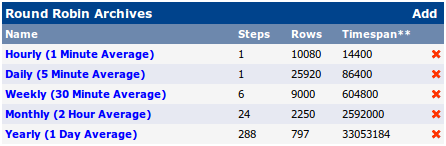
Bad Cacti RRA settings for 1 minute polling
What’s the problem? When combined with a 60-second step size (see below), this defines a 1-minute RRA. But it doesn’t define the 5-minute, 30-minute, 2-hour, or 1-day RRAs. It defines TWO 1-minute RRAs, along with RRAs for 6 minutes, 24 minutes, and 288 minutes (about 4 hours). Remember, these are calculated as “(step size in data source) * (steps in RRA definition)”.
1-minute Polling: The Right Way
Here’s the correct way. Use step sizes of 1, 5, 30, 120, and 1440.
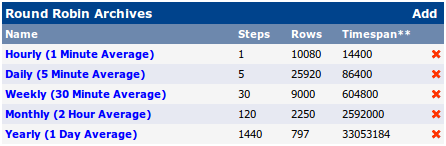
Good Cacti RRA settings for 1 minute polling
1 and 5-minute Polling
This will give you correct 1-minute polling data while keeping the consolidated RRAs at the expected frequencies. But what if you want some graphs to keep 1-minute resolution (network statistics, CPU load) and others at 5-minute resolution (filesystem space)? To do that you must define two sets of RRAs. Leave the default RRAs alone or only rename them – their IDs are hard-coded into certain places in Cacti. Create new ones for 1-minute polling like so.
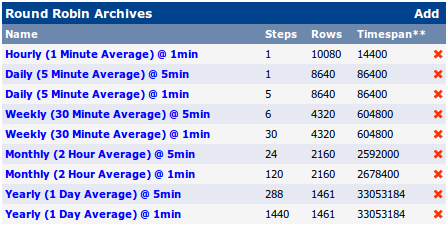
Good RRA settings for 1- and 5-minute polling.
These are intended to be used in groups. Select only the “@ 1min” RRAs for 1-minute data, and only the “@ 5min” RRAs for 5-minute data.
Adjust “Step” and “Heartbeat” on all Data Source templates
In Cacti, navigate to “Console” -> “Templates” heading -> “Data Templates”. Click on a Data Template you wish to use 1-minute polling.
Under “Associated RRAs”, select the new 1-minute RRAs you created. Use the Ctrl key and scroll the tiny selection window to select all “@ 1min” RRAs. Deselect the “@ 5min” RRAs.
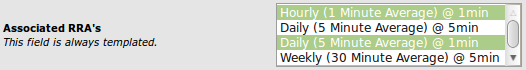
Cacti associated RRA settings for Data Templates using 1-minute polling.
Then adjust the Step setting to 60.
Cacti step settings for Data Templates using 1-minute polling.
And the Heartbeat setting to 120. This must always be twice the Step setting. It would be nice if it were automatically calculated in the next release.
Cacti heartbeat settings for Data Templates using 1-minute polling.
At the bottom of the page, press Save. Repeat the “Heartbeat” step for each Data Source Item tab.
The final settings should like this:
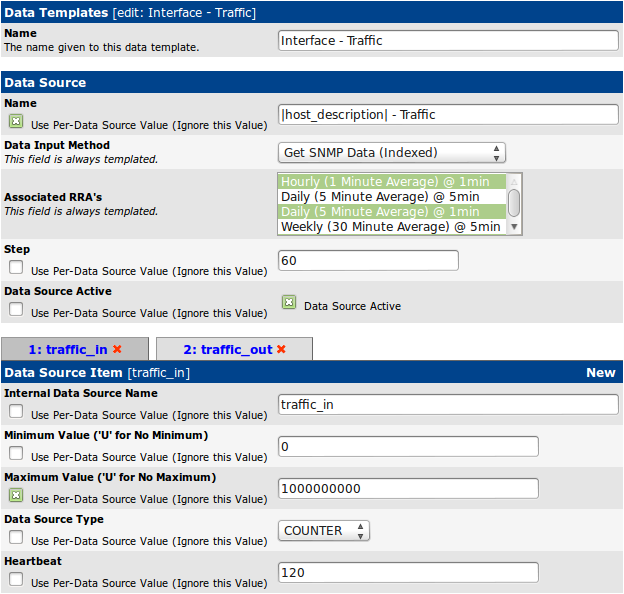
Cacti settings for Data Templates using 1-minute polling.
Repeat this step for every Data Template you wish to update. This is a tedious job. If you’re good with MySQL you can change these settings directly in the database, but I don’t recommend it.
Change the poller frequency in cron
Unfortunately it’s possible to configure cron several ways. Under Debian/Ubuntu, cacti installs a configuration file /etc/cron.d/cacti. From a terminal, edit it with:
sudo editor /etc/cron.d/cacti
Source installs recommending editing root’s crontab.
sudo crontab -e -u root
The entry will look something like this:
MAILTO=root
*/5 * * * * www-data php /var/www/cacti/poller.php >/dev/null 2>/var/log/cacti/poller-error.log
Change this to the following, then save and quit.
MAILTO=root
* * * * * www-data php /var/www/cacti/poller.php >/dev/null 2>/var/log/cacti/poller-error.log
Change the poller frequency in Cacti settings
Back in Cacti, navigate to “Console” -> “Configuration” heading -> “Settings”. Then select the “Poller” tab. Change “Poller Interval” and “Cron Interval” to “Every Minute”.
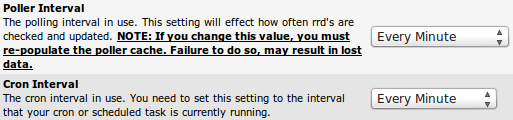
Cacti poller settings for 1-minute polling.
Note: Some people recommend not changing the cron interval. See the first comment below for clarification.
Finally, rebuild the poller cache. Navigate to “Console” -> “Utilities” heading -> “System Utilities”. Then select “Rebuild Poller Cache”. Congratulations! Cacti is now polling every minute with correct RRA settings.
Tags: cacti
-
Everyone says to leave the cron poller at 5minutes and just change the poller interval to 1. However your guide states the opposite?
-
Many people do indeed say that. This needs clarification:
1. Always change the poller internal to 1 minute.
2. If you change the crontab entry to 1 minute, change the Cacti cron setting to 1 minute.
3. If you do not change the crontab entry (leave it at 5 minutes), then also leave the Cacti setting at 5 minutes.
-
Nice post Tyler, I’ve just configured two different installs for 1-minute polling (Cacti-0.8.7e on Ubuntu Server 10.04 and Cacti-0.8.8b on Scientific Linux 6.4). Thanks for taking the time to bring this information together in one place. You response to Pico’s comment also helps to clear up any confusion about Cacti Poller settings.
For those interested, more information can be found on the Cacti Forum about poller frequency and the values used for the “Rows” in the RRA configuration.
Having a read of the RRD documentation helps too.
Cheers.
-
Congratulations on setting it all up! It’s not an easy task.
I created a spreadsheet for this, in case you want it.
-
I went ahead and converted it to a google sheet as well:
-
Wonderful, thanks for sharing it.
-
Thanks for the detail guide. You recommend changing polling parameters before using cacti. How the changes would affect graphs and overall work on the production cacti server? What would you advise?
-
Hi Martin,
If you make the above changes, all new data sources and graphs will work on 1-minute intervals, while all existing data sources and graphs will continue to use the old settings. They won’t, for instance, use 1-minute polling for new data. So if you want 1-minute polling, you have to bin the old 5-minute data.
Technically, it’s possible to extract the old 5-minute data as XML using rrdtool and then manipulate it to create 1-minute data and import it again. In practice, that’s a lot of work and requires good knowledge of rrdtool.
-
Is it possible to have some hosts polled every 1 minute and some every 5 minutes? We only need the 1-minute granularity on some hosts, and don’t want to hammer some others (across a WAN link). Would just deselecting the 1-minute RRA in the data template take care of it?
-
If you edit the data template, it will affect all new data sources/graphs created from that time. I have some graph types that use 5 min while others use 1 min, but if you wanted different hosts to do that, you’d have to make two complete sets of data source templates. And then either make two sets of graph templates (each referencing 1 or 5 min data sources), or spend a lot of time editing each graph as you create it.
It’s probably not worth it, to be honest. Even my Raspberry Pi can handle being polled every minute, and it’s not an issue for the server either.
-
Thanks for your article, it’s clear and well explained !
David
-
Hi Tyler,
how did you solve the problem with the “gaps” in the graphs – or didn’t you run into that issue? I have an Octo-Core Xeon server with 16 GB RAM and an SSD drive that uses one minute polling, and it shows a three minute “gap” in ALL graphs every 9.5 hours. I have a second non-SSD server with half that CPU power and only a quarter of that RAM running on five minute polling, and it does NOT show these gaps — it only showed them when it was still using one minute polling, too.
The polling cycle finished in 22 seconds on the Octo Core machine (which also hosts a Smokeping server) and it needs around 45 seconds on the smaller server. So I don’t think the gaps come from unfinished polling cycles.
What both Cactis have in common is their horrible slowness on the front end. The slower server now uses nginx instead of Apache and both machines have the php5-fpm package installed and running, but that didn’t produce any improvements. At all. Cacti’s web interface is a pain to use on both machines, and I really don’t know what screw I could still turn to make it faster.
Do you have any suggestions for how to improve the responsiveness of the web interface?
Thanks a lot in advance,
Winni-
Hi Winni,
It seems you have two problems:
A. Gaps in your graphs of 3 minutes, every 9.5 hours.
I have some questions:
1. 9.5 hours is really odd. The 3-minute graph is really odd. Does this correspond to any load issues on the server, or any other background task?
2. What is your poller interval in cron? 1 minute or 5? If set to 5, the PHP or spine process runs 5 times, once per minute, then terminates (and waits for the next cron run to start it again). If 1, it just runs when cron calls it. I always use a 1-minute interval.
3. If you delete and re-create a data source using 1-minute RRAs, does the gap still exist?
4. Are you graphing disk I/O of the Cacti server? That may help identify the problem. See templates here.
Right now, I don’t believe your issue isn’t related to poller cycles, but is something else. Which takes me to issue 2:
B. Unresponsive GUI.
I’m concerned these are related. What is your base OS? Web server? How does the web server launch PHP? Are you using PHP or spine for polling? I’m using Ubuntu 10.04 and 12.04, Apache, mod-php5, and spine.
-
Hi Tyler, I could finally identify the cause for the unresponsive web interface: The superlinks plugin! As soon as I disabled the plugin, the Cacti’s web interface became fast again.
To be sure that it’s the plugin itself that causes the slow downs and not that external web pages that it loads, I re-enabled the plugin and just disabled all external web pages. The result was a sluggish Cacti web interface. Only disabling the plugin itself restores the full speed of the server.
I don’t think that this will “magically” remove the gaps in the graphs, but at least it explains why Cacti responded so slow.
-
Hi Winni,
That’s really strange. I’m using Superlinks 1.4 on my home server with Cacti 0.8.8b on Ubuntu 12.04, and it has no impact at all on the interface.
-
I haven’t look at the source code of the plugin, yet. The pages that superlinks is supposed to load contain Java applets and are hosted on a decimator appliance. Maybe superlinks fetches those pages every time Cacti’s user interface refreshes even when they are not going to be displayed?
-
In my tests, it only loads the URL (or page) when you click on it. I monitored Apache’s access log while testing. My only Superlink is a static HTML page on the same server (which itself simple redirects to / on the same server).
Checking that log while clicking around the Cacti interface shows that the only non-standard access is the Superlinks-generated tab image. Perhaps there’s some issue with the tab image generation?
-
Hi Tyler,
Thanks for the reply! :)
I honestly have no idea why this happens ever 9 1/2 hours (give or take a couple of minutes). Also, both Cacti servers “disagree” on the exact moment when the three minute gap occurs. The second one usually shows the gap several minutes later. The only CRON job that in theory would explain the pause is the backup job – that usually launches between six and seven o’clock in the morning and the gaps don’t happen when it’s run. So it must be something else.
The OS: 64-Bit Ubuntu 12.04 LTS on both servers. Cacti1 uses Apache, Cacti2 currently has a test-run with nginx. Both originally were default Ubuntu LAMP stacks. When the performance got worse, I installed FPM/FastCGI on both servers, but that did not improve the performance at all. Both use Spine. One minute CRON intervals on the one-minute-polling Cacti1, five-minute CRON intervals on the five-minute polling Cacti2.
Disk I/O on Cacti1 normally is around 1.6MB/s (write) and 400k (read), if the graph is correct. When the backup runs, read goes up to around 47MB/s and ends with a short write peak of 22MB/s – if the graph is correct at all. The monthly averages peak at 8.3M (read) and 3.9M (write), so I don’t know which numbers I can really trust. But these peaks always happen during the back window in the morning. I don’t have any disk I/O numbers for the HDD-based Cacti2; it’s a test machine that only monitors a fracture of the devices anyway.
All 8 cores of Cacti1 show a CPU load between 28 and 32 per cent. “top” shows the usual suspects: rrd-tool and php have the most hunger for CPU resources (with up to 86% for sometimes multiple rrd-tool processes).
Since this is a production server, I’m not sure if I can easily delete data sources. I’ll try to pick a few that won’t hurt anybody and will let you know if that helped. It’s also possible that the RRA values are not in order; some are different to those that you listed in your articles. I should also double check that.
Thanks,
Winni -
BTW, I am also posting in this thread on Cacti.net; there you can also see some of the graphs I’m talking about.
-
OMG Thanks SO MUCH! There is so much WRONG information out there. Follow the instructions, folks, this just works.
Cacti 88b yum install
Centos 6.5 -
Posted wrong place…ugh.
OMG Thanks SO MUCH TYLER! There is so much WRONG information out there. Follow the instructions, folks, this just works.
Environment:
Cacti 88b yum install
Centos 6.5Cam
(the guy with sweet 1 minute graphs that still has hair left) -
I went ahead and converted it to a google sheet as well:
-
how can you make this changes automaticly (when you add another device you dont need to repat all steps abovefor all chart
-
Thank you very much man!
Just enabled it on 0.8.8b and it works like a charm !!!
Thanks a lot ^^ !
-
THis is just amazing, it works for me. Cacti 0.8.8a on Windows server 2012.
I did everything except changing the error-log.php setting.Thanks
Rico -
Hi Tyler,
Thanks for the detail posting. I am very new to Cacti. I have followed every steps to setup cacti with 1 minute polling but unfortunately graphs are still refreshing after 5 minutes whereas in /var/log/cacti/cacti.log poller is showing 1 minute interval. May be I did something wrong in setting that’s why graphs are not refreshing properly. Please help me to fix the issue. If you need more info let me know.
-
Ankan,
Cacti’s page refresh is not related to its polling cycle. It is set per-user in User Management. Set it to 60 seconds for your user like so:
-
nice article, i has try but i have eror like this
10/24/2014 03:42:09 PM – CMDPHP: Poller[0] WARNING: SNMP Walk Timeout for Host:127.0.0.1
what happen
so, my grpahing so long, never show
-
Your problem has nothing to do with 1-minute polling. Are you setting up Cacti for the first time? Start by verifying that you can do an SNMP walk at all.
snmpwalk -v 2c -c public localhost
Replace “public” with your SNMP community (password). If that fails or times out, resolve that issue first.
-
Tyler,
Extremely helpful. I was going the other way – I have a Script data source which only updates every 10 minutes. I left the poller interval in cacti and the cron entry alone at 5 minutes, and I noticed that the poller ran my script every other invocation, as expected! Thought I was home free – had no clue about the RRAs. So I set up 10 minute RRAs per your design.
What got me here were gaps in the graphs using the stock 5-minute RRAs. Gaps every 3 hours or so like clockwork. I know enough to make sure that the rrd updates were happening every 10 minutes and the new data was actually getting into my rrd files. Watching the poller output and querying the rrd directly told me this. So it was the graphing step that was leaving the gaps in the graph, since the 10-minute data is all there in the rrd. I am hoping the new rrd’s with the correct 10 minute step values fix it, I will let you know!
I have one question – you “left off” an hourly graph for the 5-minute data in you example above. I believe the correct way to create one is to have exactly the same settings as the 5 minute daily graph, but just change the display interval down to 14400. All you are doing here is “zooming in” the graph. Do you agree?
In any case your explanation was perfect. Thanks.
-
No, you don’t need the “hourly” graph with 5-minute polling. If high-resolution data is unavailable, Cacti uses the lower-resolution data. So zooming the daily graph gives you same effect. But collecting useless “hourly” data will take disk space for no reason.
-
Hi,
I’ve follow this HOW-TO, 1 minute polling work (see Cacti log). But 1 minute graph resolution does not work on actual Graph (I’ve more than 1000 graph). 1 minute graph resolution work on nows graph.
Am I obliged to bin all my actual RRD data ?
What is the procedure to have 1 minute graph resolution on existing graphs ? :)
-
There is no procedure to convert existing 5-minute graphs to 1-minute graphs. Your existing 5-minute RRD files have no 1-minute RRAs, and they cannot be modified within cacti.
Your options are:
1. Create a second set of graphs for these hosts. Disable the old graphs and keep them for a few months. Honestly, this is the smart move.
2. Use a combination of rrdtool export commands; some kind of scripted XML parsing to generate the missing 1-minute data by copying the 5-minute data 5 times (for GAUGE data) or to extrapolate it into fifths (for COUNTER data), and to correct the STEPS and HEARTBEAT fields; then rrdtool import it into new files; and overwrite the old files only while cacti poller is not running.
Option 2 is not trivial.
-
Hi,
Thanks for your answer.
I migrate my cacti to 1minute polling, all was ok expect the lost of rrd
-
I’m not seeing any way to disable old graphs?!
-
Hi,
I’m setting up a new cacti environment for our enterprise platform and want 1 min results and no consolidation
for hour, day and month rrd’sFor now i have defined this, but i do not fully understand the ‘row’ setting in cacti and how to calculate it ?
step row secs
Hourly (1 Minute Average) 1 1440 14400
Daily (1 Minute Average) 1 1440 86400
Weekly (1 Minute Average) 1 10080 604800
Monthly (1 min Average) 1 44670 2678400
Yearly (5 min Average) 5 105408 33053184Could you please advise how to do this ?
Thanks,
Peter -
Hi again
I think i found the answer earlier in the thread in the calculator here :
thanks,
Peter -
Thanks for the great guide.
I need to create graphs at sub minute rate. I don’t understand the need for the Poller interval, and cron interval setting, besides the actual cron it self. Can someone clearly on this, and give a point in the right direction how to make sub minute polling.
Thanks in advance,
Eli-
Eli,
I don’t know how well it would work. I would try the following for twice a minute polling, based on my four steps at the top:
1. Create 30-second RRA settings.
2. Adjust “Step” and “Heartbeat” on all 30-second Data Source templates using the same math as above. IE, use 30 and 60.
3. Make a script for cron. This is necessary, because cron cannot spawn less frequently than one minute. So this script should handle its own spawning like:
poller_cmd &
sleep 30
poller_cmd &Set this script to run every minute in cron. You may also need some logic to detect and prevent starting the poller while the previous run isn’t done yet. You also need to make sure that your poller can finish in this time, so first test to see how fast the poller can finish.
4. Change the poller frequency in Cacti settings. I have no idea what happens if you set this to 1 minute but do this trick. This is where you need to test.
Let me know how it goes, please.
-
Hi Tyler,
The RRA, Step and Heartbeat part are exactly correct.About the polled:
The cron needs to stay 1 minute. It seems that if you tune the poller frequency, cacti manages the poller in such a way that it actually polls the devices once “every frequency time”.
I completely agree that you need to make sure that the poller instances dont overun each other. For most people sub minute polling intervals are an over kill – I have a special case here, where i need very fast polling on a very small number of targets.Thanks for all the help.
Eli-
So do you have a working example of sub-minute polling? If so, please post a reply with the steps you used, in summary, for others that need it.
-
1) CRON entry should be at 1 minute interval.
2) Under: Console->settings->poller-> cron interval = 1 minute
3) Under: Console->settings->poller-> poller interval = 10 seconds
4) Under: Console-> Management->Data Sources->RRA – add a new RRA with the following parameters
a. Name: 1 Hour (10 Seconds average)
b. Consolidation functions – mark all
c. X-Files factor – 0.5
d. Steps – 1
e. Rows – 360
f. Timespan – 3600
5) Under: Console-> Templates->Data Templates->(Interface – Traffic)
a. Mark the new RRA: 1 Hour (10 seconds average)
b. Change step to 10
c. Save
d. Click traffic_in and change heartbeat to 20 – save
e. Click traffic_out and change heartbeat to 20 – save
f. Rebuild poller cacheMaybe other RRA’s need to be updated as well – I didnt try this.
Eli
-
You will definitely need to update other RRAs if you are using other RRAs with the “1 Hour (10 Seconds average)” RRA. For instance, for a 60-second average, you must set the Steps to 6, as that’s 6 steps of 10 seconds (the smallest RRA in use).
-
>Then adjust the Step setting to 60.
>And the Heartbeat setting to 120.Adjusting Step and Heartbeat settings, from CLI for ALL data templates.
mysql -ucactiuser -pcactiuser cacti -e ‘UPDATE data_template_data SET rrd_step=60’
mysql -ucactiuser -pcactiuser cacti -e ‘UPDATE data_template_rrd SET rrd_heartbeat=120’ -
I’m using data template “Unix – Ping Host”. When I click on it, I see that everything is highlighted except the Hourly (1 minute average).
My graphs don’t have the 1 minute average. What are the exact steps. Looking up there but still not sure. -
Just noticed that the version 0.8.8b, there is an option to select the “Hourly (1 minute average)”. Once you select that, it will display your existing data in the “Hourly (1 minute average)” as well as the other ones -cool.
-
My question is if I’m monitoring a device with the Ping. I’m using version 0.8.8b and I’m selecting the Hourly (1 minute average) option as well. When my device goes down for one minute, not sure why it doesn’t show a gap or show up in the graph. Should it show up in the graph or have a gap of 1 minute where there is no data?
-
Great post, but it leaves one question open. Nobody could or was willing to answer until now and I hope you know it. I created a second set of RRA for @30sec resolution (keeping the @5min RRAs intact). One the one hand side, I have a lot of devices that only needs to be queried every 5 minutes and the poller.php script runs about 1 min to do so. So no problem here. On the other hand side I have 5 devices that requires to be queried with 30sec resolution. If only these three devices are queried and nothing else, the query needs <5sec. So no problem, too.
But what happens if both queries clash together, i.e. on every 30th run of the poller script? If this happens not only the three fast devices need to be queried, but all other devices, too.
Is the script single-threaded and will wait for all queries to be completed before a new query is spawned? This would mean that 6 measurements of the high-frequencies devices are skipped. (The runtime of the script to query all devices is approx. 1min, divided by 10sec.) Or is the script "intelligent" enough to query the slow devices in an interlinked fashion with the high-frequencies devices such that no measurement is skipped? With "interlinked fashion" I mean the following pattern (SDn = slow device #n, FDn = fast device #n): FD1, FD2, FD3, SD1, SD2, SD3, FD1, FD2, FD2, SD4, SD4, SD6, FD1, FD2, FD3, SD7, … and so on.
-
Cacti’s default poller is cmd.php, which is single-threaded but can run multiple processes. The number of threads is configured in the Cacti settings page. It is intelligent enough to dispatch requests between them and balances reasonably well. However, it doesn’t know that you want the 30-second data sources to take priority over the 5-minute ones. They’ll just be scheduled in the right 30-second window, and could be executed last in the poll.
You need to ensure that the poller completes inside the cycle time of your shortest poller. Since you’ve chosen 30-second RRAs, then all polling runs need to finish in 30 second or less so the next run doesn’t start before it finishes. If that happens, the older poller is killed, the new one starts, and you have gaps in your graphs where polling didn’t finish.
If you want to use a multiple threads as well as or in addition to processes, you should use spine. This is the Cacti poller written in C, and it’s much faster. The down sides are that it’s “not the official poller”, which means nothing, and that you have to compile it after each upgrade, which requires the difficult step of typing “./configure; make ; make install”. I’ve used spine in multiple installs for 6+ years and never had a problem with it. It will definitely poll faster.
If you want to track poller effiency, install Gandalf’s poller templates.
-
So Spine is my solution? Does Spine also require the whole poll of all devices to be finished within the shortest time window or is Spine smart enough to start the next 30s-interval poll even if the 5min-poll is still running? Is Spine smart enough to prioritize the 30-second devices within the 5-minute poll such that they are already finished before the next 30-second poll starts? (I doubt that Spine dispatches one thread per device, because that might get overwhelming.)
I don’t have a problem with manually installing Spine. I already thought of completely writing my own poller and scheduler. I am a fairly good C/C++ programmer and familiar with POSIX, especially pthreads. If I take that path my poller would not be called by Cron at all but be started as a system service during boot and daemonize into background. In that case I would disable polling by Cacti completely and use Cacti just for graphical output. (I already do this with one data source.) But actually I would like to avoid that path if possible.
-
No, spine is your solution for “I want to use threads, and poll faster”. Numbers vary, but in my case I found it to be twice as fast. I run 1 spine process with x threads, where x = 2 * CPU cores. It doesn’t prioritise data sources in any way, nor does it allow the poller to overrun its frequency.
I suggest setting up the cacti poller templates and getting a few hours’ data of poller run times. Then install spine and switch to it. Then try adjusting process and thread parameters for 15 minutes per experiment. The graphs of the poller performance will tell you what you need to know.
-
Stop me if i tell bullshit but Cacti is a poller and not an a scheduler so you can’t have items at 30sec and other at 5min polling interval no ?
-
You are incorrect. Cron triggers Cacti’s poller on a schedule, but the poller decides what to poll based on the RRA settings for each data source.
-
I’m not totally sure if cacti version 0.8.8b already have the 1 Minute thing. I see there is a post to go from 5 minute to 1 minute average. I’m not sure what version of cacti does that apply to. If somebody could answer this it would be great.
-
Ric, it applies to all versions after 0.8.7, up to present.
General advice for Cacti: just try it. Documentation and community are small, and the tool is complicated. Be willing to experiment, and make regular mysqldumps of the cacti database so you can restore if you need to.
-
This is what I have. Now that it is polling every minute, if my machine is offline for 2 minutes I should see a gap in the graph right? I have turned my test machine off for 5 minutes but it doesn’t show a gap. There is a gap initially, but after I turn the machine back on, that gap is filled up again.
I have already rebuild the poller cache and set the both to every minute as well as chaining the cacti cron to 1 minute as well. Anything I need to check on to make this work correctly?Round Robin Archives
Add
Name
Steps
Rows
Timespan**
Hourly (1 minute average) @ 1min
1
10080
14400

Hourly (1 Minute Average)
1
500
14400

Daily (5 Minute Average) @ 1min
5
8640
86400

Daily (5 Minute Average)
1
600
86400

Weekly (30 Minute Average)
6
700
604800

Weekly (30 Minute Average) @ 1min
30
4320
604800

Monthly (2 Hour Average)
24
775
2678400

Monthly (2 Hour Average) @ 1min
120
2160
2678400

Yearly (1 Day Average)
288
797
33053184

Yearly (1 Day Average) @ 1min
1440
1461
33053184
 -
Awesome article. Very useful. Thanks a lot.
-
Hey guys, for some reason it just doesn’t work for me.
In 0.8.8c the default poller/crob intervals are 1min, so I left it as-is and created the new RRAs for “@ 1min” and associated the new RRAs to the date templates (interface – Traffic) but still hourly (1min avg) graph generated with timestamps of 5min when zooming in. -
anybody ??? :(
-
Tyler,
I simply love your blog!
What do you use for your default SNMP and Ping timeouts? Also, do you use UDP Ping or ICMP Ping? Lastly, what setting do you use for the downed host detection under the poller?
Todd
-
You should tune your defaults and poller settings to match your use case. For example:
80 hosts / (1 process * 8 threads) = 10 hosts per thread.
In the worst case, each host times out. So you have 60 seconds / 10 hosts = 6 seconds per host maximum, assuming no startup delay for the poller.
In this example, I would use 5000 ms timeout so the poller always finishes in 1 minute.
My personal monitoring server uses the following settings. These are not a recommendation for all use cases.
Downed Device Detection: SNMP Uptime
Ping Timeout Value: 5000
SNMP Timeout: 5000I also monitor some hosts using ICMP ping, using an advanced ping template which I’ll share some day.
-
Thanks. It was helpful!
-
Good morning Tyler,
thanks for you post. It has been really useful however we haven’t been able to turn it on.
After having applied your changes we get this message on our cacti.log:
root@gvip:/var/log/cacti# cat cacti.log | grep “out of sync”
01/25/2016 09:55:01 AM – POLLER: Poller[0] WARNING: Cron is out of sync with the Poller Interval! The Poller Interval is ’60’ seconds, with a maximum of a ‘300’ second Cron, but 301 seconds have passed since the last poll!And we lose any graphs.
We’ll be very thankful if you could give us any clue about this issue.
We think it could be related to poller’s duration but we are not really sure.
Thanks and regards
-
I need to know more about how you are editing the crontab. What OS? Editing with what command? What does it look like now? Did you set it to run every minute as in step 3?
-
Good morning Tyler
I edit my crontab with the commando crontab -e -u root. I show you its content:
*/5 * * * * cacti php /var/www/html/cacti/poller.php > /dev/null 2>&1 /dev/null 2>&1 Configuration (Heading) -> Settings -> Poller (Tab) we get Maximum Concurrent Poller Processes set to 1.
I suppose that our current poller cannot finish before 60 seconds then a second poller cannot start every minute but I’m not really sure.
Is there any way to confirm my suspicions?
Let me know any other output you would like to know
Thanks a lot and kind regards
-
Good morning Tyler
I edit my crontab with the commando crontab -e -u root. I show you its content:
*/5 * * * * cacti php /var/www/html/cacti/poller.php > /dev/null 2>&1 — This is the current line which has been working so far.
#*/1 * * * * cacti php /var/www/html/cacti/poller.php > /dev/null 2>&1 — This was the line that we tried but it didn’t workI share with you some outputs from our current /var/log/cacti/cacti.log:
root@gvip:/var/log/cacti# tail -n 5000 cacti.log | grep overrunning
01/26/2016 10:00:01 AM – POLLER: Poller[0] WARNING: There are ‘1’ detected as overrunning a polling process, please investigate
01/26/2016 10:05:00 AM – POLLER: Poller[0] WARNING: There are ‘1’ detected as overrunning a polling process, please investigateroot@gvip:/var/log/cacti# tail -n 500 cacti.log | grep Exiting
01/26/2016 10:06:26 AM – PHPSVR: Poller[0] Maximum runtime of 300 seconds exceeded for the Script Server. Exiting.
root@gvip:/var/log/cacti# tail -n 5000 cacti.log | grep Exiting
01/26/2016 10:00:00 AM – POLLER: Poller[0] Maximum runtime of 298 seconds exceeded. Exiting.
01/26/2016 10:01:20 AM – PHPSVR: Poller[0] Maximum runtime of 300 seconds exceeded for the Script Server. Exiting.
01/26/2016 10:05:00 AM – POLLER: Poller[0] Maximum runtime of 298 seconds exceeded. Exiting.
01/26/2016 10:06:26 AM – PHPSVR: Poller[0] Maximum runtime of 300 seconds exceeded for the Script Server. Exiting.In our Console – Configuration (Heading) – Settings – Poller (Tab) we get Maximum Concurrent Poller Processes set to 1.
I suppose that our current poller cannot finish before 60 seconds then a second poller cannot start every minute but I’m not really sure.
Is there any way to confirm my suspects?
Thanks a lot and kind regards
-
So you have 2 problems:
1. Your poller isn’t finishing in time. Find out what you are doing with the script server to cause this. Also, don’t use just 1 concurrent process, as that will take as much as (num of data sources) * (timeout maximum per source). I use spine, which lets me use threads instead of processes, and I run 16 concurrent threads on a 4-core machine, typically with a 5-second timeout on each data source.
2. Your poller runs every 5 minutes, not 1 minute.
In conclusion, you have problems you need to resolve before you should consider running a 1-minute poller, or you’ll just have that problem 5 times more often.
-
Hello Tyler, thanks for your how to. But i have a problem, my host is check every 5 min.
my RRAs : http://pix.toile-libre.org/upload/original/1460022719.png
my Data Template : http://pix.toile-libre.org/upload/original/1460022779.png
my seeting : http://pix.toile-libre.org/upload/original/1460022846.png
my data source : http://pix.toile-libre.org/upload/original/1460022927.png
my log :
04/07/2016 11:57:02 AM – SYSTEM STATS: Time:0.2797 Method:cmd.php Processes:1 Threads:N/A Hosts:3 HostsPerProcess:3 DataSources:3 RRDsProcessed:2
04/07/2016 11:57:02 AM – CMDPHP: Poller[0] Time: 0.1789 s, Theads: N/A, Hosts: 2
04/07/2016 11:57:02 AM – CMDPHP: Poller[0] Host[2] DS[18] SNMP: v3: 192.168.0.10, dsname: traffic_out, oid: .1.3.6.1.2.1.2.2.1.16.3, output: 1854703451
04/07/2016 11:57:02 AM – CMDPHP: Poller[0] Host[2] DS[18] SNMP: v3: 192.168.0.10, dsname: traffic_in, oid: .1.3.6.1.2.1.2.2.1.10.3, output: 3737665122
04/07/2016 11:57:02 AM – CMDPHP: Poller[0] Host[2] RECACHE DQ[1] OID: .1.3.6.1.2.1.1.3.0, output: 187391725
04/07/2016 11:57:02 AM – CMDPHP: Poller[0] Host[1] DS[3] CMD: perl /usr/share/cacti/site/scripts/linux_memory.pl MemFree:, output: 1756000
04/07/2016 11:57:01 AM – POLLER: Poller[0] NOTE: Poller Int: ’60’, Cron Int: ’60’, Time Since Last: ’60’, Max Runtime ’58’, Poller Runs: ‘1’
04/07/2016 11:56:01 AM – SYSTEM STATS: Time:0.1233 Method:cmd.php Processes:1 Threads:N/A Hosts:3 HostsPerProcess:3 DataSources:1 RRDsProcessed:1
04/07/2016 11:56:01 AM – CMDPHP: Poller[0] Time: 0.0249 s, Theads: N/A, Hosts: 2
04/07/2016 11:56:01 AM – CMDPHP: Poller[0] Host[1] DS[7] CMD: perl /usr/share/cacti/site/scripts/unix_processes.pl, output: 91
04/07/2016 11:56:01 AM – POLLER: Poller[0] NOTE: Poller Int: ’60’, Cron Int: ’60’, Time Since Last: ’60’, Max Runtime ’58’, Poller Runs: ‘1’
04/07/2016 11:55:01 AM – SYSTEM STATS: Time:0.1123 Method:cmd.php Processes:1 Threads:N/A Hosts:3 HostsPerProcess:3 DataSources:1 RRDsProcessed:1
04/07/2016 11:55:01 AM – CMDPHP: Poller[0] Time: 0.0140 s, Theads: N/A, Hosts: 2
04/07/2016 11:55:01 AM – CMDPHP: Poller[0] Host[1] DS[6] CMD: perl /usr/share/cacti/site/scripts/unix_users.pl , output: 1
04/07/2016 11:55:01 AM – POLLER: Poller[0] NOTE: Poller Int: ’60’, Cron Int: ’60’, Time Since Last: ’59’, Max Runtime ’58’, Poller Runs: ‘1’
04/07/2016 11:54:02 AM – SYSTEM STATS: Time:0.1141 Method:cmd.php Processes:1 Threads:N/A Hosts:3 HostsPerProcess:3 DataSources:1 RRDsProcessed:1
04/07/2016 11:54:02 AM – CMDPHP: Poller[0] Time: 0.0127 s, Theads: N/A, Hosts: 2
04/07/2016 11:54:02 AM – CMDPHP: Poller[0] Host[1] DS[5] CMD: perl /usr/share/cacti/site/scripts/loadavg_multi.pl, output: 1min:0.00 5min:0.03 10min:0.05
04/07/2016 11:54:02 AM – POLLER: Poller[0] NOTE: Poller Int: ’60’, Cron Int: ’60’, Time Since Last: ’61’, Max Runtime ’58’, Poller Runs: ‘1’
04/07/2016 11:53:01 AM – SYSTEM STATS: Time:0.1139 Method:cmd.php Processes:1 Threads:N/A Hosts:3 HostsPerProcess:3 DataSources:1 RRDsProcessed:1
04/07/2016 11:53:01 AM – CMDPHP: Poller[0] Time: 0.0155 s, Theads: N/A, Hosts: 2
04/07/2016 11:53:01 AM – CMDPHP: Poller[0] Host[1] DS[4] CMD: perl /usr/share/cacti/site/scripts/linux_memory.pl SwapFree:, output: 731132
04/07/2016 11:53:01 AM – POLLER: Poller[0] NOTE: Poller Int: ’60’, Cron Int: ’60’, Time Since Last: ’60’, Max Runtime ’58’, Poller Runs: ‘1’
04/07/2016 11:52:01 AM – SYSTEM STATS: Time:0.2512 Method:cmd.php Processes:1 Threads:N/A Hosts:3 HostsPerProcess:3 DataSources:3 RRDsProcessed:2
04/07/2016 11:52:01 AM – CMDPHP: Poller[0] Time: 0.1600 s, Theads: N/A, Hosts: 2
04/07/2016 11:52:01 AM – CMDPHP: Poller[0] Host[2] DS[18] SNMP: v3: 192.168.0.10, dsname: traffic_out, oid: .1.3.6.1.2.1.2.2.1.16.3, output: 1513661324
04/07/2016 11:52:01 AM – CMDPHP: Poller[0] Host[2] DS[18] SNMP: v3: 192.168.0.10, dsname: traffic_in, oid: .1.3.6.1.2.1.2.2.1.10.3, output: 3523594897
04/07/2016 11:52:01 AM – CMDPHP: Poller[0] Host[2] RECACHE DQ[1] OID: .1.3.6.1.2.1.1.3.0, output: 187361658
04/07/2016 11:52:01 AM – CMDPHP: Poller[0] Host[1] DS[3] CMD: perl /usr/share/cacti/site/scripts/linux_memory.pl MemFree:, output: 1759280
04/07/2016 11:52:01 AM – POLLER: Poller[0] NOTE: Poller Int: ’60’, Cron Int: ’60’, Time Since Last: ’60’, Max Runtime ’58’, Poller Runs: ‘1’
04/07/2016 11:51:02 AM – SYSTEM STATS: Time:0.1579 Method:cmd.php Processes:1 Threads:N/A Hosts:3 HostsPerProcess:3 DataSources:1 RRDsProcessed:1It’s for the host 2, i can see : the host is check every 5 min, but the poller start every 1 min
I don’t understant. Can you help me ?
Thanks a lot
-
Did you add the 1-min polling after creating the data sources for this host? Is Host[2] DS[18] a 1-minute data source or was it created with the 5-minute templates? Check data source ID 18.
One thing that jumps out is that you have an “Hourly (1 Minute Average) @ 5min” RRA, which makes no sense. You should have only “Hourly (1 Minute Average) @ 1min” RRA. However, as long as it’s not selected on any data templates, it won’t matter.
-
Hi Tyler,Trying to do this for the first time but I cant write the changes to the cron file? i can make them but it wont write them and it says I don’t have write access?
I am logged in with administrator permissions? -
Hi, we used of Cacti in our network, but our 1 yearly graph, only shows 6 mounts. I changed RRAs setting accordingly your tutorial, but it seems our problem dos not solved.
I checked cacti.log too, and all of logs are exists in this, but the graphs don’t show them.
How can I solve this problem?-
Changes to RRAs or data templates are only applied to data sources when they are created. IE, you need to delete and re-create your data sources.
-
Hi, I am fairly new in Cacti along with the add-ons. How will I edit the crontab to change the details to 1-minute?
-
Hi Tyler,
I installed cacti 0.8.8h from epel repository, and I find the default settings are just the same as you mentioned in “Bad Cacti RRA settings for 1 minute polling”, what should I do now? modify the values to correct steps, rows, and timespan?
-
sorry, I find someone already asked this question.
-
Yes, do that. And delete/recreate any data sources you have already created, because changes to data templates and RRA definitions are not retroactive.
-
cacti 1.0.4 released, I can’t find any place to change RRA setting to 1 minute, would you check if cacti 1.0.x still need to be adjusted for 1 minute polling?
-
http://forums.cacti.net/viewtopic.php?f=4&t=56794
feature: Data Source Profiles replace RRA settings allowing a single system to have multiple polling intervals
-
Tyler, would appreciate an updated post with the latest Cacti. Some of these settings have moved to Presets -> “Data Profiles” but defaults for High Collection Rate profile are quite different than your recommendations.
-
I’ve updated the post to explain that this was written for 0.8.x. Sometime soonish I’ll either set up Cacti 1.0, or switch to Prometheus, and write about one of them.
-
Thanks for the article Tyler.
I assume that if I wanted to do the reverse (eg: add a 30 min poll time interval that isn’t just a “Weekly” view), that I could change the polling intervals and introduce a specific 30 min group of RRA’s?
Basically I’ve got some devices that I really don’t need to poll that regularly (even 30 min is sort of overkill, but at least the graphs won’t be quite so blocky), so I was thinking of creating a slow set of RRA’s (as below):
Daily (30 Min Ave), Steps 1
Weekly (1 Hour Ave), Steps 2
Monthly (2 Hour Ave), Steps 4
Yearly (1 Day Ave), Steps 48Think this will work? Also, I want to poll some devices at normal speed, so I’m assuming that I don’t need to change the cron job in any way.
FWIW: Part of the reason is the devices just don’t update a lot (some values might not change for days), and partly that they’re on somewhat low-bandwidth links, so I’d like to avoid the extra network traffic from the polling of those devices.
-
Yes, you can do exactly that, Stuart. Just leave the cron entry alone, but otherwise set up the RRA defaults as you suggest.
-
Hi does anyone of you guys works with the
1.2.5 version??
I have a production server that uses default .
— i did follow the idea of your configurations here.. however it seem the dropdown for aggregates does not give me the option tonselect a 5minutes
— my aim is to creat a graph that can holds a 5minutes data for daily weekly monthly and yearly…
-
-
-
-
-
-
-
-
-
-
-
-
-
-
-
-
-
-
-
-
-
-
-
-
-
-
-
-
-
-
-
-
-
-
83 comments
Comments feed for this article
Trackback link: https://www.tolaris.com/2013/07/09/cacti-and-1-minute-polling/trackback/